Olympic Medal Table Explained: How Countries Are Ranked
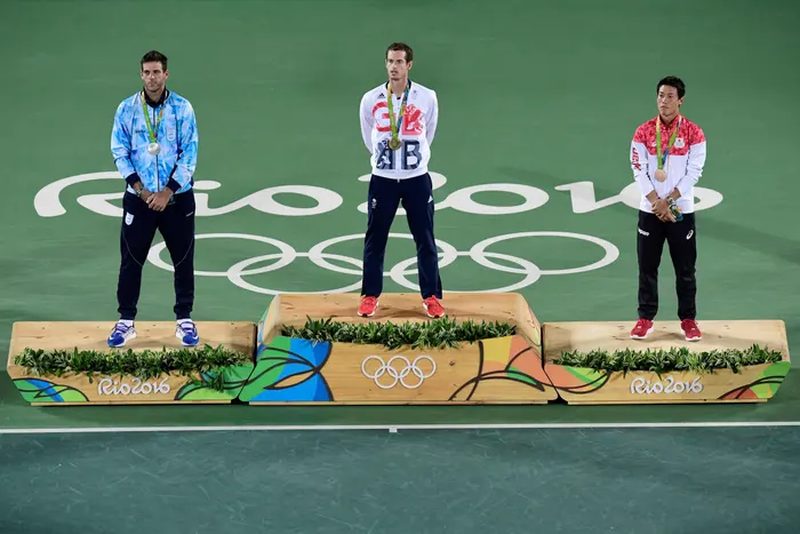
Every Olympic Games produces two competitions: the athletes’ contest for medals, and the nations’ contest for the top of the medal table. The table’s ordering looks simple, but its conventions spark fierce debate every four years, from whether golds should outweigh total medals to whether tables should be adjusted for population or wealth. Here is how the medal table works and what it really tells us.
How are countries ranked on the medal table?
The International Olympic Committee’s convention ranks nations by gold medals first: the country with the most golds tops the table, regardless of total medals. Silver medals break ties in golds, and bronze medals break ties in silvers. If nations remain tied, they share the ranking and are listed alphabetically. This gold-first system is the standard used by the IOC and most international media, and it shapes how nations perceive success: one gold outweighs any number of silvers. The convention is not a formal IOC ranking, the committee insists the Games are about athletes, not nations, but the table is published everywhere and followed obsessively.
Why do some countries use total medals instead?
The United States media traditionally ranks by total medals, a convention that sometimes produces a different leader from the gold-first table. The total-medal view argues that every podium finish represents excellence and that consistency across events deserves recognition. The debate flares whenever the two systems disagree: in 2008, China topped the gold table while America led on totals, and both nations claimed victory. Neither system is official; both are journalistic conventions. The disagreement reveals a philosophical split: is Olympic success about producing champions, or about producing medallists?
How do population and wealth change the picture?
Raw medal tables favour large, wealthy nations, so analysts build alternative tables. Medals per capita reshuffle the order dramatically, elevating small nations like San Marino, Bermuda and Dominica, which have won medals with tiny populations. Medals per GDP highlight efficient sporting systems, often favouring nations like Jamaica and Kenya that convert limited resources into podiums. These adjusted tables are popular with fans of smaller nations and useful for analysts, but they have quirks: per-capita tables reward microstates disproportionately, and wealth adjustments depend on debatable economic measures. They are best read as supplements to, not replacements for, the standard table.
What does the medal table hide?
The table flattens rich stories into numbers. It does not show fourth places, the near misses that nations remember longest. It treats a gold in the 100 metres the same as a gold in any other event, though their cultural weight differs enormously. It ignores the depth of a nation’s programme: a country with twenty finalists and no medals looks worse than one with a single lucky champion. It says nothing about hosting effects, judging controversies or doping disqualifications that redistribute medals years later. And it cannot capture the moments that define Games: the underdog finalists, the record-breaking performances, the sportsmanship that no table records. The medal table is a scoreboard, not a story.
How has the table evolved historically?
The medal table mirrors geopolitics. The Soviet Union and the United States traded the top spot through the Cold War, turning the table into ideological scoreboard. China’s rise from its 1984 return to topping the gold table in 2008 marked a sporting superpower’s arrival. Host nations typically surge: Britain’s climb from 36th in 1996 to third in 2012 showed what targeted funding could do. Recent Games have seen new winners emerge as sports like skateboarding and climbing diversified the medal pool. India’s best-ever hauls, though modest by superpower standards, have tracked its growing Olympic investment. The table is, among other things, a history of nations’ sporting ambitions written in gold, silver and bronze.
FAQs
Who topped the medal table at Paris 2024? The United States topped the table on both gold medals and total medals at the Paris Olympics.
Does the IOC officially rank countries? No. The IOC publishes medal tables for information but insists the Games are a competition between athletes, not nations.
What happens to the table when medals are stripped for doping? Medals are reallocated to the next finishers and historical tables are revised, sometimes years after the Games.
Gold first, ties by silver, arguments forever: the Olympic medal table is sport’s most debated spreadsheet. Read it for what it is, a rough map of sporting power, and look beyond it for the stories that make the Games matter.
Source: International Olympic Committee medal database

Khabar 24h Editorial Desk — our explainers are prepared by the Khabar 24h editorial team using AI-assisted research tools, and every piece is reviewed by a human editor before publishing. We do not claim original reporting: our work is turning complex topics into simple, accurate summaries. Spotted an error? Write to contact@khabar24h.com — our corrections policy aims for same-day review.
More from this author →